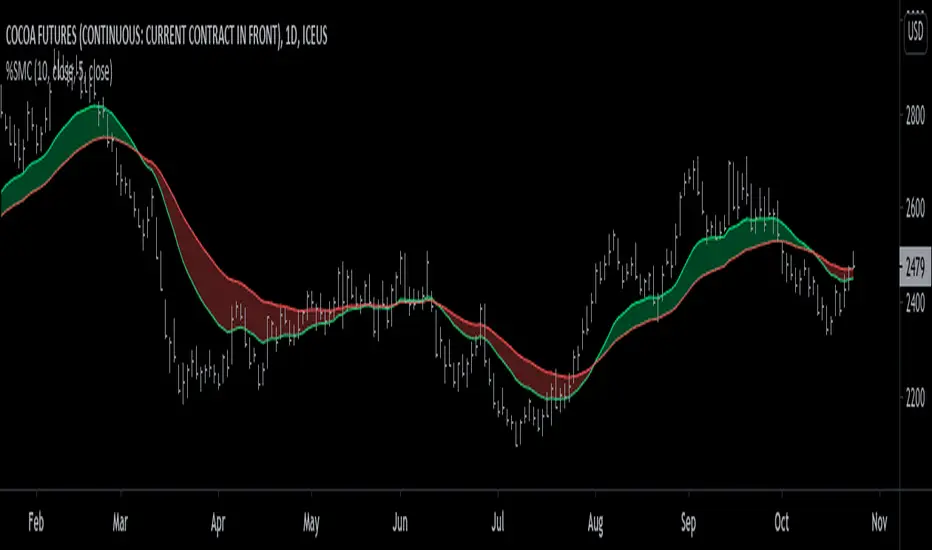
% Sensitivity MA Cross [racer8]This is my third published indicator on % Sensitivity MA, if you're not familiar with it, go check out my first one.
This time its a cross between 2 % Sensitivity MAs.
Cerca negli script per "ma cross"
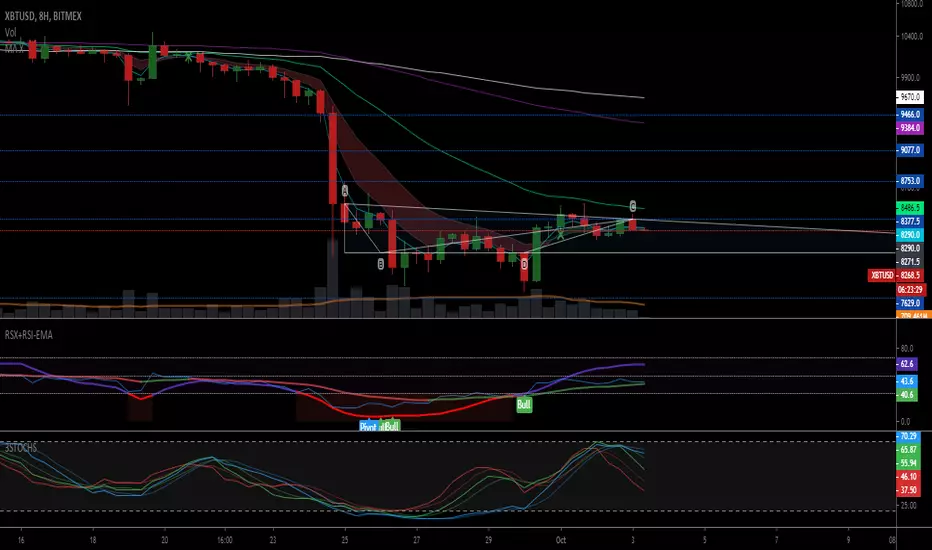
Moving Average CrossNote: This is just an idea, I did not test this for trading.
MA Cross normally uses close as source in the moving averages, this script uses highs and lows as source.
In an uptrend you will see the 20 period high EMA and 50 period low EMA, once they cross, the indicator will switch to 20 period low EMA and 50 period high EMA. This gives it way less fake crosses as you see in the image on BTC.
As i said above, this is just an idea. If you change the settings, they might not cross at all.. so do your own testing.
Hope this code can help someone.

MultiType Shifting Predictive Moving Averages (MA) CrossoverJust 2 Moving Averages with adjustable settings and shifting capability, plus signals and predicting continuations.
At the time of publish these different types of MAs are supported:
- SMA (Simple)
- EMA (Exponential)
- DEMA (Double Exponential)
- TEMA (Triple Exponential)
- RMA (Adjusted Exponential)
- WMA (Weighted)
- VWMA (Volume Weighted)
- SWMA (Symmetrically Weighted)
- HMA (Hull)
I'm looking forward to any idea about filtering the signals. Thanks.

SW System - EMAs - Pivots v2//=========================================================
// Indicator Name: SW System - Traditional Pivots and MA cross alerts - Plus Psychological Sup/Res
// Type: Main panel
// Version: 2
// Description: MA cross alerts - Plus Psychological Sup/Res
// Traditional Pivots in any time frame
// Author: Sergio Waldoke (Argentina)
// First Release: June 23rd, 2019
// Last Release: June 27 th, 2020
//
// This source code is subject to the terms of the Mozilla Public License 2.0 at mozilla.org
// © galileogalilei1 (Sergio Waldoke)
//==========================================================
Set of tendence and Support/Resistance with Pivots and psychological S/R in main prices. Four moving averages are provide which may be chosen between EMA or simple Moving Average.
Some alerts in crosses are provide.
Enjoy!

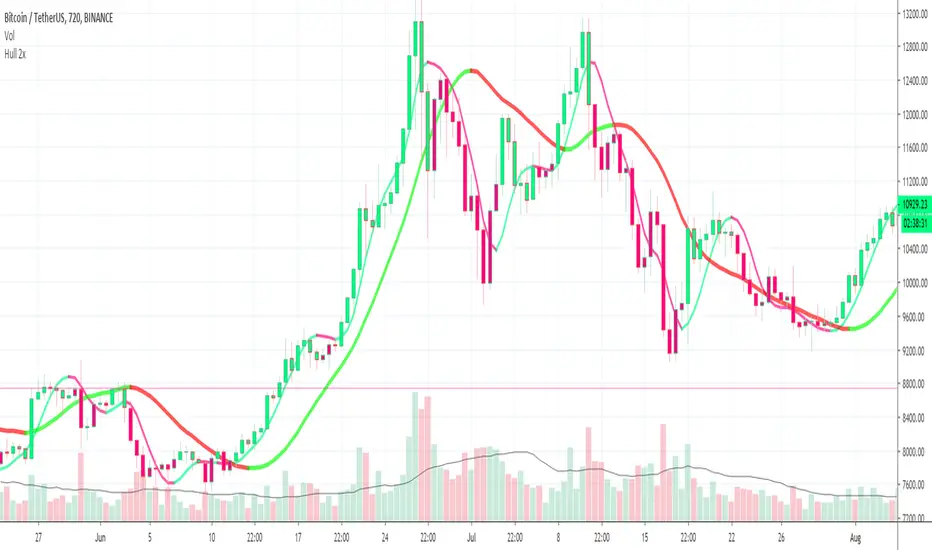
Hull 2xPlots 2 Hull MA's, 1 Fast and 1 Slow
Can Paint Bars according to Hull MA Cross
Buy / Sell Alerts for MA Crossing
Fast-Slow MA Cross on custom timeframe (with alerts)A simple script for tracking your moving average crossing with an option for a fixed time frame and a 3 additional MAs for reference.
TN MA Cross Potential entry when the MA 5 crosses the MA 13 on an uptrend. This indicator is not meant for a you to buy and sell. It is a way to see if your fav coins are heading in an uptrend.

Bitazu MA 5,10Displays 5,10 MAs on a single indicator.
Useful for Crypto trading and reduced the number of indicators needed to view multiple EMAs
When shorter MA crosses over the longer it's a good sign of Bullish/Bearish reversal.
This sentiment is more true at longer timeframes, such as daily candles, as the trend has more momentum.

Bitazu MA 10,20Displays 10, 20 MAs on a single indicator.
Useful for Crypto trading and reduced the number of indicators needed to view multiple MAs
When shorter MA crosses over the longer it's a good sign of Bullish/Bearish reversal.
This sentiment is more true at longer timeframes, such as daily candles, as the trend has more momentum.

Rainbow MA Cloud█ OVERVIEW
Rainbow MA Cloud displays 8 Moving Averages as a gradient-colored cloud to visualize trend direction and strength. The "rainbow" effect shows momentum through ribbon width, while perfect MA alignment signals strong trending conditions.
█ CONCEPTS
The indicator uses 8 MAs with Fibonacci-based default lengths (8, 13, 21, 34, 55, 89, 144, 233) to create a layered view of price momentum across multiple timeframes.
Perfect Alignment Detection:
• Bullish Alignment — All 8 MAs in ascending order (MA1 > MA2 > ... > MA8)
Indicates strong uptrend with momentum across all timeframes
• Bearish Alignment — All 8 MAs in descending order (MA1 < MA2 < ... < MA8)
Indicates strong downtrend with aligned selling pressure
• Mixed — MAs are not in sequential order, suggesting consolidation or transition
Ribbon Width:
• Widening ribbon = Trend acceleration, increasing momentum
• Narrowing ribbon = Trend weakening, potential reversal or consolidation
█ FEATURES
1 — MA Configuration
Choose from EMA, SMA, WMA, VWMA, or HMA calculation methods.
All 8 MA lengths are fully customizable.
2 — Color Themes
Five built-in themes: Rainbow, Warm, Cool, Neon, Mono.
Creates visually distinct gradient from fast to slow MAs.
3 — Alignment Background
Green background during bullish alignment.
Red background during bearish alignment.
Helps quickly identify strong trending periods.
4 — Trend Signals
Labels appear when perfect alignment forms.
"BULL ALIGN" for bullish, "BEAR ALIGN" for bearish.
5 — Information Panel
Real-time display of alignment status, trend strength percentage,
ribbon width, price position relative to cloud, and MA values.
█ HOW TO USE
Entry Signals:
• Look for alignment signals (BULL/BEAR ALIGN) as trend confirmation
• Enter long when bullish alignment forms with price above cloud
• Enter short when bearish alignment forms with price below cloud
Trend Following:
• Stay in position while alignment background color persists
• Widening ribbon confirms trend continuation
• Exit or reduce when alignment breaks (background disappears)
Support/Resistance:
• Cloud edges act as dynamic support (bullish) or resistance (bearish)
• Price entering cloud suggests consolidation or potential reversal
█ LIMITATIONS
• Alignment signals are lagging by nature (based on MA crossovers)
• Works best on trending markets; generates mixed signals during ranging periods
• Ribbon width measurement uses outer MAs only (MA1 vs MA8)
█ COMPANION INDICATOR
Use "Rainbow MA Width" indicator for detailed Z-Score analysis of ribbon expansion/contraction patterns.


Moving Average ProjectionDisplays 2-5 moving averages (solid lines) and projects their future trajectory (dashed lines) based on current trend momentum. This helps you anticipate where key MAs are heading and identify potential future support/resistance levels.
Important: Projections show where MAs would move IF the current trend continues—they're not predictions. Market conditions change, so use projections as planning tools, not trading signals.
General Settings
Number of MAs (2-5) controls how many moving averages display on your chart. Start with 2-3 to avoid clutter. Projection Bars (1-100) determines how far into the future to project—use 10-20 for intraday charts and 20-40 for daily charts. Lookback for Slope (2-100) sets the number of bars used to calculate trend slope, where shorter lookbacks are more responsive and longer ones are smoother. The default of 20 works well for most situations.
Individual MA Settings (MA 1-5)
Each MA has four settings: Length sets the period for the MA (common values are 9, 20, 50, 100, and 200), Type lets you choose between SMA, EMA, WMA, HMA, VWMA, or RMA (EMA is most popular), Color sets the historical MA line color, and Projection Color sets the projected line color (usually a lighter or transparent version of the main color).
MA Types Quick Reference: EMA is most popular and responsive to recent prices. SMA gives equal weight to all periods and is the smoothest. HMA is very responsive with low lag. VWMA incorporates volume data.
Quick Setup Examples
Day Trading: 3 MAs (9/21/50 EMA), 10-15 projection bars, 10-15 lookback
Swing Trading: 2 MAs (50/200 EMA), 20-30 projection bars, 20 lookback
Scalping: 2 MAs (9/20 EMA), 5-10 projection bars, 5-10 lookback
How to Use
Trend Identification: An uptrend shows price above rising MAs with projections pointing up. A downtrend shows price below falling MAs with projections pointing down. Consolidation appears as flat MAs with horizontal projections.
Support & Resistance: Rising MA projections act as future dynamic support levels, while falling MA projections act as future dynamic resistance levels.
Anticipating Changes: Watch for projected MA crossovers before they happen. When projections converge, expect volatility or consolidation. Steep projections suggest unsustainable trends, so be cautious. Flat projections indicate ranging markets.
Trade Planning: Check the current trend using MA alignment, then look at projections to gauge trend continuation likelihood. Use projected MA levels for potential targets or stop placement.
Important Tips
When Projections Work Best: Projections are most reliable in stable trending markets with consistent momentum, low volatility environments, and away from major news events.
When to Be Cautious: Use caution during high volatility or choppy price action, around major economic releases, when projections show extreme or parabolic angles, and during trend transitions.
Combine With Other Analysis: Don't trade projections alone. Use them alongside price action, volume, support and resistance levels, and other indicators for confirmation.
Best Practices
Start with 2-3 MAs to avoid chart clutter. Match your projection and lookback bars to your trading timeframe. Use consistent color schemes for quick interpretation. Adjust settings as market conditions change. Always use proper risk management—projections are planning tools, not guarantees.
Troubleshooting
Projections not showing: Check that Projection Bars > 0 and you're viewing the most recent bar
Chart too cluttered: Reduce number of MAs or increase projection color transparency
Projections too volatile: Increase lookback bars or switch to EMA/SMA from HMA
Can't see certain MAs: Verify "Number of MAs" setting includes them (MA 3 won't show if set to 2)

NY ORB - Full Dynamic SystemNY ORB - Full Dynamic Strategy Summary
1. Opening Range and Session Timing
Opening Range (ORB) Calculation: The strategy identifies the ORB High and ORB Low by tracking the highest high and lowest low during the specified New York pre-market window, which is set by default from 8:30 to 8:45 (New York time).
Entry Window: Trading activity is restricted to a specific entry period, typically starting shortly after the ORB is established (default: 8:50 to 12:00).
Hard Exit Time: Any remaining open positions are automatically closed at a fixed exit time (default: 13:25).
2. Trade Entry Logic and Filters
An entry (Long or Short) is generated when the price breaks out of the established ORB, provided it passes a series of optional filters:
Direction Control: The user can restrict the strategy to trade Long Only, Short Only, or Both.
Second Breakout Logic: An optional filter that requires the price to break out, reverse back into the range, and then break out again, confirming momentum after a consolidation.
Confirmation Candle Count: An optional filter that checks the close of a previous candle (e.g., 1 or 2 candles ago) to ensure the price was still inside the range, preventing premature entry.
Technical Filters (Optional): The entry is only executed if it aligns with selected indicators:
RSI: Filters for non-overbought (Long) or non-oversold (Short) conditions.
MACD: Requires the MACD line to be above/below the Signal line for alignment.
VWAP: Requires the price to be above/below the Volume-Weighted Average Price.
Trend Filter (SMMA): Requires the price to be above/below a 50-period Simple Moving Average.
3. Dynamic Risk and Exit Management
This strategy features highly configurable stop-loss and profit-taking mechanics:
Primary Stop Loss Methods: The Stop Loss distance can be dynamically chosen from four types:
Fixed: A fixed number of ticks.
ATR: Based on a multiple of the Average True Range (ATR).
Capped ATR: ATR-based, but with a hard maximum tick limit.
OR-Based: Based on a multiple of the actual ORB High-to-Low range.
Dynamic Profit Target: The Take Profit level is calculated dynamically based on a multiplier of either the ATR or the ORB Range.
Breakeven Stop:
If enabled, the Stop Loss automatically moves to the entry price (Breakeven) once the price moves a predetermined distance in the profitable direction.
An Adaptive Breakeven option allows the trigger distance to be calculated as a percentage of the overall ATR Profit Target.
Trailing Stop: The strategy uses a trailing stop, which can be custom-set (fixed ticks) or dynamically tied to the ATR. An optional feature Auto Tighten Trailing reduces the trailing multiplier once the breakeven level is hit.
MA Cross Exit: An alternative, counter-trend exit mechanism that closes the trade if the price crosses back over the chosen Moving Average (either SMMA or VWAP), overriding the pending profit target.
4. Daily Account Management
The strategy includes crucial daily risk controls to protect capital and lock in profits:
Daily Profit Limit: If the total daily PnL (realized and unrealized) hits a predefined maximum profit threshold (in ticks), all trades are closed, and new entries are blocked for the remainder of the trading day.
Daily Loss Limit: Conversely, if the total daily PnL hits a predefined maximum loss threshold, all trades are closed, and new entries are blocked for the remainder of the day.

Best MA Finder: Sharpe/Sortino ScannerThis script, Best MA Finder: Sharpe/Sortino Scanner, is a tool designed to identify the moving average (SMA or EMA) that best acts as a dynamic trend threshold on a chart, based on risk-adjusted historical performance. It scans a wide range of MA lengths (SMA or EMA) and selects the one whose simple price vs MA crossover delivered the strongest results using either the Sharpe ratio or the Sortino ratio. Reading it is intuitive: when price spent time above the selected MA, conditions were on average more favorable in the backtest; below, less favorable. It is a trend and risk gauge, not an overbought or oversold signal.
What it does:
- Runs individual long-only crossover backtests for many MA lengths across short to very long horizons.
- For each length, measures the total number of trades, the annualized Sharpe ratio, and the annualized Sortino ratio.
- Uses the chosen metric value (Sharpe or Sortino) as the score to rank candidates.
- Applies a minimum trade filter to discard statistically weak results.
- Optionally applies a local stability filter to prefer a length that also outperforms its close neighbors by at least a small margin.
- Selects the optimal MA and displays it on the chart with a concise summary table.
How to use it:
- Choose MA type: SMA or EMA.
- Choose the metric: Sharpe or Sortino.
- Set the minimum trade count to filter out weak samples.
- Select the risk-free mode:
Auto: uses a short-term risk-free rate for USD-priced symbols when available.
Manual: you provide a risk-free ticker.
None: no risk-free rate.
- Optionally enable stability controls: neighbor radius and epsilon.
- Toggle the on-chart summary table as needed.
On-chart output:
- The selected optimal MA is plotted.
- The optional table shows MA length, number of trades, chosen metric value annualized, and the annual risk-free rate used.
Key features:
- Risk-adjusted optimization via Sharpe or Sortino for fair, comparable assessment.
- Broad MA scan with SMA and EMA support.
- Optional stability filter to avoid one-off spikes.
- Clear and auditable presentation directly on the chart.
Use cases:
- Traders who want a defensible, data-driven trend threshold without manual trial and error.
- Swing and trend-following workflows across timeframes and asset classes.
- Quick SMA vs EMA comparisons using risk-adjusted results.
Limitations:
- Not a full trading strategy with position sizing, costs, funding, slippage, or stops.
- Long-only, one position at a time.
- Discrete set of MA lengths, not a continuous optimizer.
- Requires sufficient price history and, if used, a reliable risk-free series.
This script is open-source and built from original logic. It does not replicate closed-source scripts or reuse significant external components.

MK_OSFT - Multi-Timeframe MA Dashboard with Alerts - v1.0Multi-Timeframe Moving Average Dashboard with Advanced Alerts
A comprehensive multi-timeframe moving average indicator that displays MA levels from 6 different timeframes simultaneously on your chart, complete with intelligent labeling, customizable alerts, and performance-optimized plotting.
*** Key Features ***
Multi-Timeframe Analysis
Monitor MA levels from 6 timeframes: 5m, 15m, 1H, 4H, Daily, and Weekly
Clean visual separation with customizable colors for each timeframe
Smart label positioning prevents overlapping and ensures readability
Intelligent Alert System
Individual alert toggles for each timeframe
Cross-above and cross-below MA alerts with once-per-bar frequency
Alerts only trigger on confirmed timeframe closes (no false signals)
Works across all trading pairs on your current chart
Flexible Display Options
Toggle individual timeframe visibility
Choose between SMA and EMA calculations
Adjustable MA length (default: 12 periods)
Two source options: Current Bar or Last Confirmed Bar
Customizable line widths, label sizes, and colors
Advanced Plotting System
Optional plot lines that don't clutter your Style tab
Performance-optimized line drawing with historical data support
"Wait till close" behavior for smooth higher timeframe representation
Clean horizontal segments that update only on timeframe closes
Real-Time Information Table
Live countdown timers showing time remaining until each timeframe closes
Visual indicators for current price position relative to each MA
Cross direction indicators (↑/↓) for quick trend assessment
Show/Alert status display for easy configuration verification
*** Settings Overview ***
Moving Average Settings
MA Length: Adjustable period (default: 12)
MA Type: SMA or EMA
Source: Current bar vs Last confirmed bar
Individual Timeframe Controls
Show/Hide toggles for each timeframe
Individual alert enable/disable
Optional plot line with custom width
Color customization per timeframe
Visual Customization
Label size options (tiny, small, normal, large)
Label offset positioning
Minimum gap between labels to prevent overlap
Drawing order preference (larger timeframes first/last)
Smart Features
Automatic label collision detection and adjustment
Real-time countdown timers (only on live bars)
Debug table with comprehensive timeframe information
Built-in alert setup instructions
Perfect For
Swing traders monitoring multiple timeframe confluences
Day traders seeking higher timeframe bias confirmation
Anyone wanting clean, organized multi-timeframe MA analysis
Traders who need reliable alerts without false signals
Performance Optimized
Efficient line drawing system (no Style tab clutter)
Smart historical data handling
Minimal resource usage with intelligent update cycles
Works smoothly on all timeframes and symbols
Transform your chart into a comprehensive multi-timeframe analysis dashboard with this professional-grade moving average indicator.

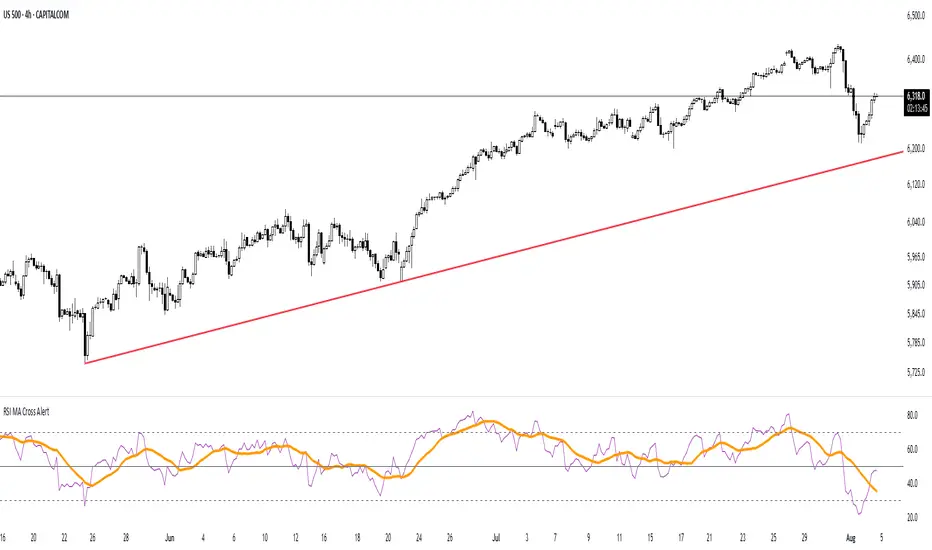
RSI MA Cross AlertAlerts when RSI-based Moving Average crosses above 50. Can be used on any symbol and timeframe. Displays RSI, RSI-MA, and levels 30/50/70.
Volume and Volatility Ratio Indicator-WODI策略名称
交易量与波动率比例策略-WODI
一、用户自定义参数
vol_length:交易量均线长度,计算基础交易量活跃度。
index_short_length / index_long_length:指数短期与长期均线长度,用于捕捉中短期与中长期趋势。
index_magnification:敏感度放大倍数,调整指数均线的灵敏度。
index_threshold_magnification:阈值放大因子,用于动态过滤噪音。
lookback_bars:形态检测回溯K线根数,用于捕捉反转模式。
fib_tp_ratio / fib_sl_ratio:斐波那契止盈与止损比率,分别对应黄金分割(0.618/0.382 等)级别。
enable_reversal:反转信号开关,开启后将原有做空信号反向为做多信号,用于单边趋势加仓。
二、核心计算逻辑
交易量百分比
使用 ta.sma 计算 vol_ma,并得到 vol_percent = volume / vol_ma * 100。
价格波动率
volatility = (high – low) / close * 100。
构建复合指数
volatility_index = vol_percent * volatility,并分别计算其短期与长期均线(乘以 index_magnification)。
动态阈值
index_threshold = index_long_ma * index_threshold_magnification,过滤常规波动。
三、信号生成与策略执行
做多/做空信号
当短期指数均线自下而上突破长期均线,且 volatility_index 突破 index_threshold 时,发出做多信号。
当短期指数均线自上而下跌破长期均线,且 volatility_index 跌破 index_threshold 时,发出做空信号。
反转信号模式(可选)
若 enable_reversal = true,则所有做空信号反向为做多,用于在强趋势行情中加仓。
止盈止损管理
进场后自动设置斐波那契止盈位(基于入场价 × fib_tp_ratio)和止损位(入场价 × fib_sl_ratio)。
支持多级止盈:可依次以 0.382、0.618 等黄金分割比率分批平仓。
四、图表展示
策略信号标记:图上用箭头标明每次做多/做空(或反转加仓)信号。
斐波那契区间:在K线图中显示止盈/止损水平线。
复合指数与阈值线:与原版相同,在独立窗口绘制短、长期指数均线、指数曲线及阈值。
量能柱状:高于均线时染色,反转模式时额外高亮。
Strategy Name
Volume and Volatility Ratio Strategy – WODI
1. User-Defined Parameters
vol_length: Length for volume SMA.
index_short_length / index_long_length: Short and long MA lengths for the composite index.
index_magnification: Sensitivity multiplier for index MAs.
index_threshold_magnification: Threshold multiplier to filter noise.
lookback_bars: Number of bars to look back for pattern detection.
fib_tp_ratio / fib_sl_ratio: Fibonacci take-profit and stop-loss ratios (e.g. 0.618, 0.382).
enable_reversal: Toggle for reversal mode; flips short signals to long for trend-following add-on entries.
2. Core Calculation
Volume Percentage:
vol_ma = ta.sma(volume, vol_length)
vol_percent = volume / vol_ma * 100
Volatility:
volatility = (high – low) / close * 100
Composite Index:
volatility_index = vol_percent * volatility
Short/long MAs applied and scaled by index_magnification.
Dynamic Threshold:
index_threshold = index_long_ma * index_threshold_magnification.
3. Signal Generation & Execution
Long/Short Entries:
Long when short MA crosses above long MA and volatility_index > index_threshold.
Short when short MA crosses below long MA and volatility_index < index_threshold.
Reversal Mode (optional):
If enable_reversal is on, invert all short entries to long to scale into trending moves.
Fibonacci Take-Profit & Stop-Loss:
Automatically set TP/SL levels at entry price × respective Fibonacci ratios.
Supports multi-stage exits at 0.382, 0.618, etc.
4. Visualization
Signal Arrows: Marks every long/short or reversal-add signal on the chart.
Fibonacci Zones: Plots TP/SL lines on the price panel.
Index & Threshold: Same as v1.0, with MAs, index curve, and threshold in a separate sub-window.
Volume Bars: Colored when above vol_ma; extra highlight if a reversal-add signal triggers

Market Sentiment Index US Top 40 [Pt]▮Overview
Market Sentiment Index US Top 40 [Pt} shows how the largest US stocks behave together. You pick one simple measure—High Low breakouts, Above Below moving average, or RSI overbought/oversold—and see how many of your chosen top 10/20/30/40 NYSE or NASDAQ names are bullish, neutral, or bearish.
This tool gives you a quick view of broad-market strength or weakness so you can time trades, confirm trends, and spot hidden shifts in market sentiment.
▮Key Features
► Three Simple Modes
High Low Index: counts stocks making new highs or lows over your lookback period
Above Below MA: flags stocks trading above or below their moving average
RSI Sentiment: marks overbought or oversold stocks and plots a small histogram
► Universe Selection
Top 10, 20, 30, or 40 symbols from NYSE or NASDAQ
Option to weight by market cap or treat all symbols equally
► Timeframe Choice
Use your chart’s timeframe or any intraday, daily, weekly, or monthly resolution
► Histogram Smoothing
Two optional moving averages on the sentiment bars
Markers show when the faster average crosses above or below the slower one
► Ticker Table
Optional on-chart table showing each ticker’s state in color
Grid or single-row layout with adjustable text size and color settings
▮Inputs
► Mode and Lookback
Pick High Low, Above Below MA, or RSI Sentiment
Set lookback length (for example 10 bars)
If using Above Below MA, choose the moving average type (EMA, SMA, etc.)
► Universe Setup
Market: NYSE or NASDAQ
Number of symbols: 10, 20, 30, or 40
Weights: on or off
Timeframe: blank to match chart or pick any other
► Moving Averages on Histogram
Enable fast and slow averages
Set their lengths and types
Choose colors for averages and markers
► Table Options
Show or hide the symbol table
Select text size: tiny, small, or normal
Choose layout: grid or one-row
Pick colors for bullish, neutral, and bearish cells
Show or hide exchange prefixes
▮How to Read It
► Sentiment Bars
Green means bullish
Red means bearish
Near zero means neutral
► Zero Line
Separates bullish from bearish readings
► High Low Line (High Low mode only)
Smooth ratio of highs versus lows over your lookback
► MA Crosses
Fast MA above slow MA hints rising breadth
Fast MA below slow MA hints falling breadth
► Ticker Table
Each cell colored green, gray, or red for bull, neutral, or bear
▮Use Cases
► Confirm Market Trends
Early warning when price makes highs but breadth is weak
Catch rallies when breadth turns strong while price is flat
► Spot Sector Rotation
Switch between NYSE and NASDAQ to see which group leads
Watch tech versus industrial breadth to track money flow
► Filter Trade Signals
Enter longs only when breadth is bullish
Consider shorts when breadth turns negative
► Combine with Other Indicators
Use RSI Sentiment with trend tools to spot overextended moves
Add volume indicators in High Low mode for breakout confirmation
► Timeframe Analysis
Daily for big-picture bias
Intraday (15-min) for precise entries and exits

[blackcat] L3 Ichimoku FusionCOMPREHENSIVE ANALYSIS OF THE L3 ICHIMOKU FUSION INDICATOR
🌐 Overview:
The L3 Ichimoku Fusion is a sophisticated multi-layered technical analysis tool integrating classic Japanese market forecasting techniques with enhanced dynamic elements designed specifically for identifying potential turning points in financial instruments' pricing action.
Key Purpose:
To provide traders with an intuitive yet powerful framework combining established ichimoku principles while incorporating additional validation checkpoints derived from cross-timeframe convergence studies.
THEORETICAL FOUNDATION EXPLAINED
🎓 Conceptual Background:
:
• Conversion & Base Lines tracking intermediate term averages
• Lagging Span providing delayed feedback mechanism
• Lead Spans projecting future equilibrium states
:
• Adaptive parameter scaling options
• Automated labeling system for critical junctures
• Real-time alert infrastructure enabling immediate response capability
PARAMETER CONFIGURATION GUIDE
⚙️ Input Parameters Explained In Detail:
Regional Setting Selection:**
→ Oriental Configuration: Standardized approach emphasizing slower oscillation cycles
→ Occidental Variation: Optimized settings reducing lag characteristics typical of original methodology
Multiplier Adjustment Functionality:**
↔ Allows fine-graining oscillator responsiveness without altering core relationship dynamics
↕ Enables adaptation to various instrument volatility profiles efficiently
Displacement Value Control:**
↓ Controls lead/lag offset positioning relative to current prices
↑ Provides flexibility in adjusting visual representation alignment preferences
DYNAMIC CALCULATION PROCESSES
💻 Algorithmic Foundation:
:
Utilizes highest/lowest extremes over specified lookback windows
Produces more responsive conversions compared to simple MAs
:
→ Confirms directional bias across multiple independent criteria
← Ensures higher probability outcomes reduce random noise influence
:
♾ Creates persistent annotations documenting significant events
🔄 Handles complex state transitions maintaining historical record integrity
VISUALIZATION COMPONENTS OVERVIEW
🎨 Display Architecture Details:
:
→ Solid colored trendlines representing conversion/base relationships
↑ Fill effect overlay differentiating expansion/compression phases
↔ Offset spans positioned according to calculated displacement values
:
→ Green shading indicates positive configuration scenarios
↘ Red filling highlights negative arrangement situations
⟳ Orange transition areas mark transitional periods requiring caution
:
✔️ LE: Long Entry opportunity confirmed
❌ SE: Short Setup validated
☑ XL/XS: Position closure triggers active
✓ RL/RS: Potential re-entry chances emerging
STRATEGIC APPLICATION FRAMEWORK
📋 Practical Deployment Guidelines:
Initial Integration Phase:
Select appropriate timeframe matching trading horizon preference
Configure input parameters aligning with target asset behavior traits
Test thoroughly under simulated conditions prior to live usage
Active Monitoring Procedures:
• Regular observation of cloud formation evolution
• Tracking label placements against actual price movements
• Noting pattern development leading up to signaled entry/exit moments
Decision Making Process Flowchart:
→ Identify clear breakout/crossover events exceeding confirmation thresholds
← Evaluate contextual factors supporting/rejecting indicated direction
↑ Execute trades only after achieving required number of confirming inputs
PERFORMANCE OPTIMIZATION TECHNIQUES
🚀 Refinement Strategies:
Calibration Optimization Approach:
→ Start testing with default suggested configurations
↓ Gradually adjust individual components observing outcome changes
↑ Document findings systematically building personalized version profile
Context Adaptability Methods:
➕ Add supplementary indicators enhancing overall reliability
➖ Remove unnecessary complexity layers if causing confusion
✨ Incorporate custom rules adapting to specific security behaviors
Efficiency Improvement Tactics:
🔧 Streamline redundant processing routines where possible
♻️ Leverage shared data streams whenever feasible
⚡ Optimize refresh frequencies balancing update speed vs computational load
RISK MITIGATION PROTOCOLS
🛡️ Safety Measures Implementation Guide:
Position Sizing Principles:
∅ Never exceed preset maximum exposure limits defined by risk tolerance
± Scale positions proportionally per account size/market capitalization
× Include slippage allowances within planning stages accounting for liquidity variations
Validation Requirements Hierarchy:
☐ Verify signals meet minimum number of concurrent validations
⛔ Ignore isolated occurrences lacking adequate evidence backing
▶ Look for convergent evidence strengthening conviction level
Emergency Response Planning:
↩ Establish predefined exit strategies including trailing stops mechanisms
🌀 Plan worst-case scenario responses ahead avoiding panic reactions
⇄ Maintain contingency plans addressing unexpected adverse developments
USER EXPERIENCE ENHANCEMENT FEATURES
🌟 Additional Utility Functions:
Alert System Infrastructure:
→ Automatic notifications delivered directly to user devices
↑ Message content customized explaining triggered condition specifics
↔ Timing optimization ensuring minimal missed opportunities due to latency issues
Historical Review Capability:
→ Ability to analyze past performance retrospectively
↓ Assess effectiveness across varying market regimes objectively
↗ Generate statistics measuring success/failure rates quantitatively
Community Collaboration Support:
↪ Share personal optimizations benefiting wider trader community
↔ Exchange experiences improving collective understanding base
✍️ Provide constructive feedback aiding ongoing refinement process
CONCLUSION AND NEXT STEPS
This comprehensive guide serves as your roadmap toward mastering the capabilities offered by the L3 Ichimoku Fusion indicator effectively. Success relies heavily on disciplined application combined with continuous learning and adjustment processes throughout implementation journey.
Wishing you prosperous trading endeavors! 👋💰

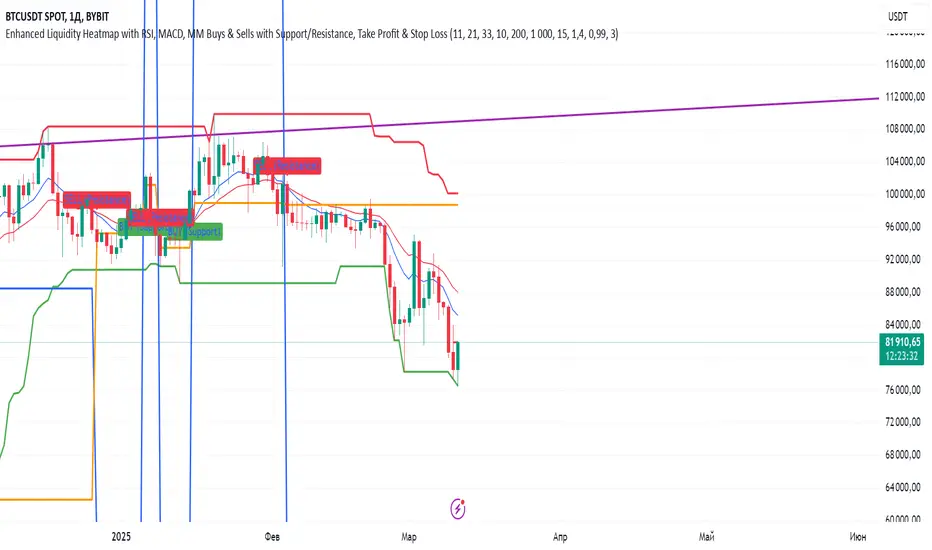
Indiq 2.0The functionality of the indicator includes the following features:
Moving Averages (MA):
The ability to adjust periods for short (short_ma_length) and long (long_ma_length) moving averages.
Display of moving averages on the chart:
Short MA (blue line).
Long MA (red line).
Generation of buy and sell signals:
Buy (BUY): When the short MA crosses the long MA from below.
Sell (SELL): When the short MA crosses the long MA from above.
Visualization of signals on the chart:
Buy is displayed as a green BUY marker below the candle.
Sell is displayed as a red SELL marker above the candle.
Liquidity Heatmap:
Liquidity levels:
Levels are calculated based on the closing price and a step (liquidity_step).
Levels are grouped by the nearest price values.
Volumes at levels:
Volume (volume) is accumulated for each liquidity level.
Levels with a volume less than min_volume_filter are not displayed.
Time filtering:
Levels that have not been updated within the last time_filter bars are not displayed.
Volatility filtering:
Levels are filtered by volatility (ATR) to exclude those outside the volatility range.
Color gradient:
The color of levels depends on volume (gradient from gradient_start_color to gradient_end_color).
Visualization:
Liquidity levels are displayed as horizontal lines.
Volumes at levels are shown as text labels.
RSI Filtering:
The ability to enable/disable RSI filtering (rsi_filter).
Liquidity levels are filtered based on overbought (rsi_overbought) and oversold (rsi_oversold) conditions.
Levels that do not meet RSI conditions are not displayed.
MACD Filtering:
The ability to enable/disable MACD filtering (macd_filter).
Liquidity levels are filtered based on the MACD histogram condition (e.g., only if the histogram is above zero).
Levels that do not meet MACD conditions are not displayed.
Display of Market Maker Buys:
Condition for market maker buys:
Volume exceeds the average volume over the last 20 bars by 2 times.
Closing price is above the opening price.
Market maker buys are displayed on the chart as orange MM Buy markers below the candle.
Indicator Settings:
Moving average parameters:
short_ma_length: Period for the short MA.
long_ma_length: Period for the long MA.
Liquidity heatmap parameters:
liquidity_step: Step between liquidity levels.
max_levels: Maximum number of levels to display.
time_filter: Time filter (last N bars).
min_volume_filter: Minimum volume for displaying a level.
volatility_filter: Volatility filter (ATR multiplier).
RSI parameters:
rsi_filter: Enable/disable RSI filtering.
rsi_overbought: Overbought RSI level.
rsi_oversold: Oversold RSI level.
MACD parameters:
macd_filter: Enable/disable MACD filtering.
Color settings:
gradient_start_color: Starting color of the gradient.
gradient_end_color: Ending color of the gradient.
Visualization:
Moving averages:
Short MA: Blue line.
Long MA: Red line.
Signals:
Buy: Green BUY marker.
Sell: Red SELL marker.
Liquidity heatmap:
Liquidity levels: Horizontal lines with a color gradient.
Volumes: Text labels at levels.
Market maker buys:
Orange MM Buy markers.
Alerts:
The ability to set alerts for signals:
Buy (BUY).
Sell (SELL).
Additional Features:
Flexible filter settings:
Filtering by time, volume, volatility, RSI, and MACD.
Extensibility:
The ability to add new filters (e.g., Stochastic, Volume Profile, etc.).
Visual customization:
Adjustment of colors, sizes, and display styles.
Summary:
The indicator provides a comprehensive tool for analyzing liquidity, generating trading signals, and tracking market maker activity. It combines:
A liquidity heatmap.
Signals based on moving averages.
Filtering by RSI and MACD.
Display of market maker buys.
Flexible settings and visualization.
This indicator is suitable for traders who want to analyze liquidity levels, identify entry and exit points, and monitor the actions of large market players.
Smart Moving AveragesSmart Moving Averages analyzes the dynamic interplay between price action and multiple moving averages to identify high-probability support and resistance zones.
The script's distinguishing features include:
Bounce detection that filters out noise by requiring specific penetration thresholds (0.1-1.5%), helping traders identify genuine support tests versus false signals
Real-time MA clustering analysis that reveals zones where multiple moving averages converge, indicating potentially stronger support/resistance levels
Statistical tracking of bounce success rates for each MA, allowing traders to identify which moving averages are most reliable for the current market conditions
Power bounce detection that combines EMA spread analysis with trend confirmation, highlighting especially strong bullish setups
Visual stack status system that instantly communicates market health through an intuitive color-coded display showing how many MAs are below price
The script helps traders make more informed decisions by quantifying the historical reliability of different moving averages while providing real-time analysis of MA interactions with price. This systematic approach moves beyond simple MA crossovers to identify higher probability trading opportunities.

Meme Coin Buy Signal Indicator by asharThis custom TradingView indicator is specifically designed for meme coins, using technical analysis indicators to identify optimal buy signals. It combines short-term moving averages, volume spikes, and Bitcoin trend alignment to pinpoint potential entry points during high-momentum periods.
Indicator Components:
Moving Averages (MA): A 5-period fast MA and a 13-period slow MA highlight short-term price momentum. Buy signals are generated when the fast MA crosses above the slow MA, indicating potential upward momentum.
Volume Spike Detection: The indicator detects high-volume periods using a multiplier. If the current volume exceeds the 10-period average volume by the set multiplier (default: 2.0), it indicates increased buying interest, which is crucial for meme coins.
Bitcoin Trend Alignment: The trend of Bitcoin, a market-wide sentiment indicator, is gauged with a 20-day moving average. Buy signals are validated only when Bitcoin is also in an uptrend, providing additional bullish confirmation for meme coins.
Buy Signal Criteria: A buy signal is triggered when:
The fast MA crosses above the slow MA.
Volume is above the average by the set multiplier.
The price is above the slow MA.
Bitcoin is trending up based on the 20-day moving average.
This indicator is ideal for meme coin traders looking to time entries with momentum-driven trends, aligning volume and trend indicators for a more comprehensive approach to high-risk assets.

Dynamic RSI Mean Reversion StrategyDynamic RSI Mean Reversion Strategy
Overview:
This strategy uses an RSI with ATR-Adjusted OB/OS levels in order to enhance the quality of it's mean reversion trades. It also incorporates a form of trend filtering in an effort to minimize downside and maximize upside. The backtest has fewer trades, as it uses substantial filtering to enhance trade quality. As you can see, I didn't cherry pick the results, so the results aren't the most beautiful thing you'll see in your life. I did this to ensure nobody gets misled. If you need a higher frequency of trades, consider removing the trend filter or increasing the length of the EMAs used for trend detection.
Features:
Dynamic OB/OS Levels: Uses ATR to adjust overbought and oversold thresholds dynamically, making the RSI more responsive in varying volatility conditions. This approach enhances signal strength by expanding the RSI range in high volatility and tightening it in low volatility.
Mean Reversion Focus: Designed for mean reversion but incorporates a trend-following filter to reduce countertrend trades. When the RSI is high, it often indicates an uptrend, so a trend filter prevents shorting in these cases and the same goes for downtrends and longing.
Trend Filtering: A moving average cross trend filter checks for the trend direction, with the RSI signal line color-coded to reflect trend shifts. Entries occur when the RSI crosses above or below the dynamic thresholds and is not a countertrend trade.
Stop Losses: Stop losses are set based on ATR distance from the entry price, providing volatility-adjusted protection.
Note:
If you're using this strategy on assets with a higher price, remember to increase the initial capital in the strategy settings. Otherwise, the strategy won't generate any (or many) trades and you'll end up with some inaccurate results.
Recommended Use:
Test it on different assets and timeframes. I’ve found the best results with standard RSI inputs, a relatively slow ATR, and a slower MA cross for trend filtering. Thus, the defaults are set that way. If the trend metrics are too slow, you’ll filter out too many good trades while allowing crummy ones; if too fast, most trades may be filtered out. As always, this has a lot of configurability so experiment to find the balance that works for your trading style.
